

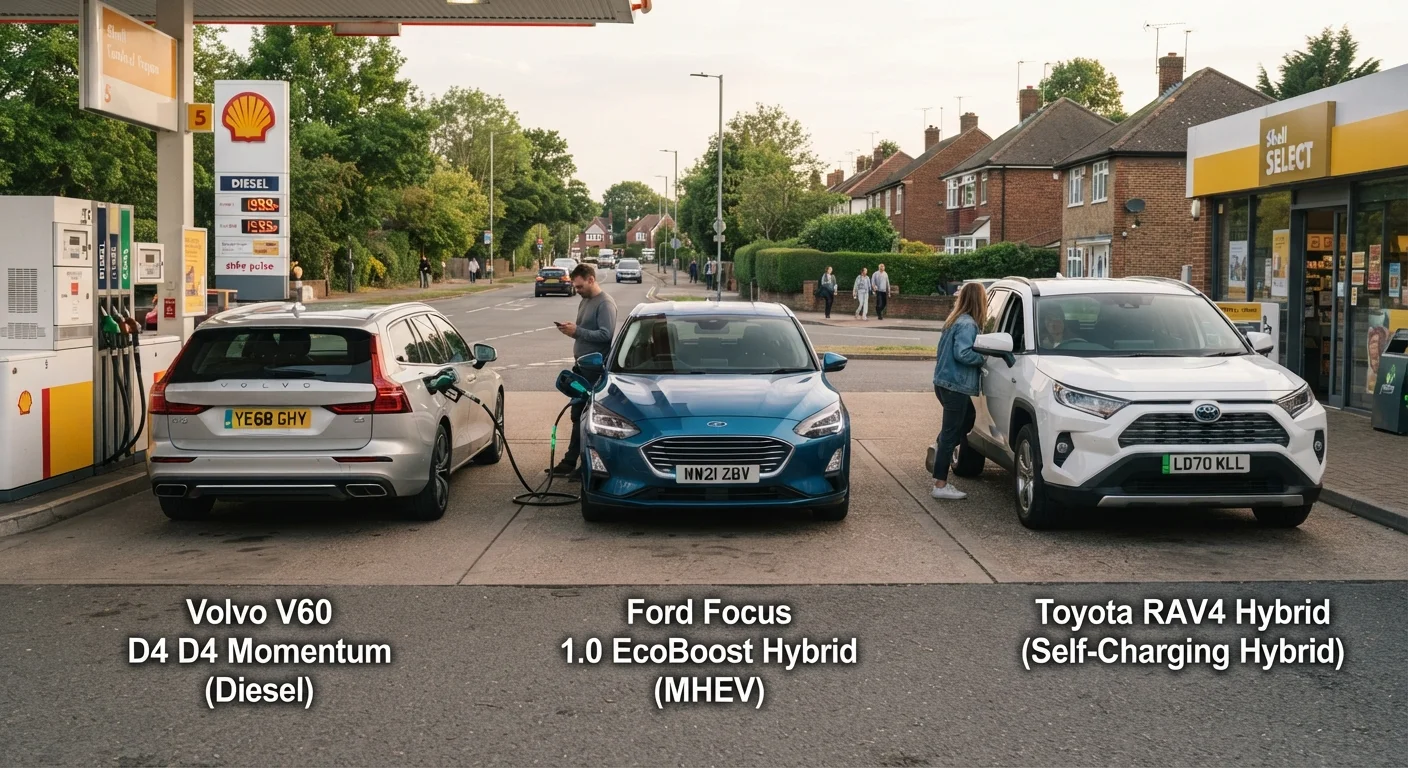
Our Verdict
No single powertrain wins for every family. Petrol suits lower-mileage drivers who value simplicity and lower upfront cost. Diesel rewards high-mileage motorway families willing to manage extra maintenance complexity. Hybrids deliver genuine savings on urban and suburban driving but require a longer ownership horizon to recoup their premium.
| Best for | Recommended |
|---|---|
| Families driving under 10,000 miles per year on mixed routes | Petrol |
| Families covering 15,000+ miles annually, mostly on motorways | Diesel |
| Families with short urban commutes and school-run driving patterns | Hybrid |
| Budget-conscious families prioritising lowest total cost of ownership | Depends on mileage - model the numbers before buying |
Why Powertrain Choice Matters for Family Running Costs
Fuel is typically the second-largest car expense after depreciation. The powertrain - whether petrol, diesel, or hybrid - determines not just what you pay at the pump, but also your servicing bills, insurance grouping, and how the car holds its value. To understand where these costs fit in the full picture of monthly motoring, see our article on where your car budget actually goes each month.
The catch is that there's no universally cheaper option. The right choice depends heavily on how far you drive each year and what kind of roads dominate your routine. A school-run parent doing 8,000 miles annually in stop-start suburban traffic faces a very different equation than a family clocking 20,000 miles on motorway commutes.
| Petrol | Diesel | Hybrid | |
|---|---|---|---|
| Typical upfront cost | Lowest | Moderate premium | Highest premium |
| Urban fuel economy | Moderate | Moderate | Best |
| Motorway fuel economy | Moderate | Best | Good |
| Servicing complexity | Low | High (DPF, AdBlue) | Moderate (battery risk) |
| Best mileage profile | Under 10,000 mi/yr | Over 15,000 mi/yr | Short urban trips |
| Depreciation risk | Stable | Softening in some markets | Holding up well recently |
Fuel Economy: What the Numbers Actually Mean
Official fuel economy figures are measured under controlled test conditions and consistently outperform what families see in real-world driving. Treat them as a basis for comparison, not a guarantee.
Petrol engines typically return 35-45 mpg in mixed driving. They're efficient at steady motorway speeds but less so in stop-start traffic. Diesel engines generally achieve 45-60 mpg on comparable routes - the combustion process extracts more energy per litre, which is why motorway mileage favours diesel strongly. Hybrids (self-charging, not plug-in) shine in urban conditions, where the electric motor handles low-speed movement and regenerative braking recovers energy that would otherwise be wasted. Real-world urban hybrid figures of 50-65 mpg are achievable; those gains shrink considerably at motorway speeds where the petrol engine does most of the work.
For habits that squeeze more out of whichever powertrain you choose, see our guide on fuel efficiency habits that make a measurable difference at the pump.
~20%
Typical fuel efficiency gap, diesel vs petrol
Diesel engines generally convert fuel to energy more efficiently, with a 15-25% mpg advantage commonly cited across comparable vehicle classes.
50-65 mpg
Real-world urban hybrid fuel economy
Self-charging hybrids frequently achieve this range in stop-start city driving, where the electric motor handles low-speed movement most effectively.
8-10 years
Typical manufacturer hybrid battery warranty
Most major manufacturers provide high-voltage battery coverage in this range, though terms vary - check the specific warranty before purchasing.
Servicing and Maintenance Costs
Fuel economy is only part of the running cost story. Servicing intervals, parts costs, and failure rates all vary by powertrain.
Petrol engines are the simplest mechanically. Parts are widely available, and most independent garages can service them competently. Oil changes, spark plugs, and air filters are the routine costs. Diesel engines add complexity: diesel particulate filters (DPFs) - devices that trap soot - can clog on short journeys and cost several hundred dollars to clean or replace. Diesel injectors are expensive. Some diesel vehicles also require AdBlue (a diesel exhaust fluid) top-ups, an often-overlooked running cost covered in our article on overlooked vehicle costs that catch families off guard.
Hybrids benefit from reduced brake wear (regenerative braking does much of the work) and often have longer service intervals. However, high-voltage battery replacement - if needed outside warranty - can be a significant expense. Most manufacturers offer battery warranties of 8-10 years, but it's worth confirming coverage before purchase. For detail on oil type differences across these engines, see our synthetic vs. conventional engine oil guide.
The Mileage Breakeven Point
Diesel and hybrid vehicles typically carry a purchase premium over equivalent petrol models. To justify that premium purely on running costs, you need to drive enough miles to accumulate sufficient fuel savings.
As a rough illustration: if a diesel costs $2,000 more upfront but saves $400 per year in fuel versus petrol, the breakeven point is five years - assuming fuel prices and your driving habits stay consistent. Hybrids carry larger premiums in many cases, and the breakeven depends on whether you're coming from petrol or diesel comparisons.
The key variables to model for your own situation are: annual mileage, predominant road type (urban, mixed, or motorway), current fuel prices, and how long you plan to keep the vehicle. Our car ownership cost worksheet can help you structure this calculation across all expense categories.
Model Your Own Mileage Before Deciding
Take your actual annual mileage, split it roughly between urban and motorway driving, then apply realistic mpg figures for each powertrain. Divide the upfront price premium by the annual fuel saving to calculate your personal breakeven period. If you're likely to change vehicles before reaching that point, the premium may not be worth it.
Insurance, Depreciation, and the Full Ownership Picture
Running costs extend beyond fuel and servicing. Insurance groupings vary by powertrain - hybrids can sometimes sit in higher groups due to higher repair costs, though this varies by model. Depreciation is another variable: diesel residuals have softened in some markets following emissions-related regulatory shifts, while hybrid values have held up well in recent years. Neither trend is guaranteed to continue.
Families deciding between one or two vehicles should also factor in whether a more fuel-efficient powertrain genuinely changes the financial case - explored in depth in our piece on owning one family car vs two. For a comprehensive view of every cost stage from acquisition through disposal, see the full picture of family vehicle ownership costs.
The honest answer is that no powertrain is universally cheaper. Run the numbers on your actual driving patterns before deciding - the math matters more than the marketing.
This article provides general information for educational purposes only and does not constitute financial or mechanical advice. Costs and figures vary by vehicle, location, and individual driving habits. Consult a qualified mechanic or financial adviser for decisions specific to your situation.
The content provided on our blog site traverses numerous categories, offering readers valuable and practical information. Readers can use the editorial team’s research and data to gain more insights into their topics of interest. However, they are requested not to treat the articles as conclusive. The website team cannot be held responsible for differences in data or inaccuracies found across other platforms. Please also note that the site might also miss out on various schemes and offers available that the readers may find more beneficial than the ones we cover.